

| Getting your Trinity Audio player ready... |
- What Is Technical Analysis?
- Why Technical Analysis Matters in 2025
- The Anatomy of Crypto Charts
- Decoding Candlestick Charts
- Identifying Trends and Key Levels
- Essential Technical Indicators for Beginners
- Advanced Strategies for Crypto Chart Analysis
- Common Mistakes to Avoid in 2025
- Practical Tips for Success in Crypto Trading
- Conclusion
- FAQs
In the dynamic world of cryptocurrency trading, understanding how to read crypto charts is a game-changer for beginners in 2025. Technical analysis, the art of interpreting price patterns and market data, empowers traders to make informed decisions in a volatile market. Whether you’re eyeing Bitcoin’s next rally or exploring altcoins, this comprehensive guide breaks down the essentials of technical analysis with actionable insights. From chart types to advanced indicators, here’s everything you need to start analyzing crypto charts like a pro.
What Is Technical Analysis?
Technical analysis (TA) involves studying historical price movements, trading volume, and patterns to forecast future price behavior. Unlike fundamental analysis, which evaluates a cryptocurrency’s underlying technology or adoption metrics, TA focuses solely on chart-based data. By identifying trends, support/resistance levels, and momentum signals, traders can pinpoint optimal entry and exit points.
Why Technical Analysis Matters in 2025
The crypto market in 2025 is more vibrant than ever, with new blockchain projects, decentralized finance (DeFi) innovations, and institutional adoption driving volatility. Technical analysis helps beginners navigate this fast-paced environment by providing a structured approach to trading. Whether you’re day trading or holding for the long term, TA offers tools to manage risks and seize opportunities.
The Anatomy of Crypto Charts
Crypto charts are visual representations of price and volume data over time. Understanding their components is the first step to mastering technical analysis.
- Advertisement -


1. Types of Crypto Charts
- Candlestick Charts: The gold standard for traders, candlesticks display open, close, high, and low prices for a chosen time frame (e.g., 1-hour, 4-hour, daily). They offer rich insights into market sentiment.
- Line Charts: Simplified charts showing only closing prices over time. Ideal for spotting long-term trends but less detailed.
- Bar Charts: Similar to candlesticks, bar charts show high, low, open, and close prices but are less visually intuitive.
Recommendation: Use candlestick charts for crypto trading due to their depth and clarity.
2. Time Frames
Charts can be viewed across various time frames:
- Short-Term: 1-minute, 5-minute, or 15-minute charts for scalping or day trading.
- Medium-Term: 1-hour or 4-hour charts for swing trading.
- Long-Term: Daily or weekly charts for position trading or investing.
Choose a time frame based on your trading style. Beginners should start with daily charts to avoid noise from shorter intervals.
3. Price and Volume
- Price Axis (Y-Axis): Displays the cryptocurrency’s price, often in USD or stablecoin pairs like USDT.
- Time Axis (X-Axis): Shows the time period (e.g., hours, days, weeks).
- Volume: Appears as bars at the chart’s bottom, indicating trading activity. High volume often validates price movements, while low volume may signal weak trends.
Decoding Candlestick Charts
Candlestick charts are the cornerstone of technical analysis. Each candlestick reflects a particular time frame and shows four essential pieces of data:
- Open: The price at the start of the period.
- Close: The price at the end of the period.
- High: The highest price reached during the period.
- Low: The lowest price reached.
Bullish vs. Bearish Candles
- Bullish (Green): The closing price is higher than the opening price, indicating buyer dominance.
- Bearish (Red): The closing price is lower than the opening price, showing seller pressure.
Key Candlestick Patterns
Recognizing patterns helps predict potential reversals or continuations. Here are five patterns beginners should know:
- Doji: A candlestick featuring a narrow body, indicating that the opening and closing prices are nearly the same, which suggests uncertainty in the market.
- Hammer: A bullish reversal pattern with a small body and long lower wick, often seen at the end of a downtrend.
- Shooting Star: A bearish reversal pattern with a small body and long upper wick, typically appearing at the top of an uptrend.
- Bullish Engulfing: A two-candle pattern where a small red candle is followed by a larger green candle, indicating a potential upward move.
- Bearish Engulfing: A two-candle pattern where a small green candle is followed by a larger red candle, suggesting a downward move.
Practice Tip: Use TradingView’s drawing tools to identify and mark these patterns on a chart to build pattern recognition skills.
Identifying Trends and Key Levels
Trends and key levels form the foundation of technical analysis, helping traders understand market direction and critical price zones.
1. Trends
- Uptrend: Characterized by higher highs and higher lows, indicating rising prices.
- Downtrend: Characterized by decreasing highs and lows, indicating falling prices.
- Sideways (Range-Bound): Prices move sideways in a horizontal band, lacking a definite trend.
To identify trends, draw trendlines:
- Uptrend Line: Connect higher lows to confirm bullish momentum.
- Downtrend Line: Connect lower highs to confirm bearish momentum.
2. Support and Resistance
- Support: A price level where buying interest prevents further declines. Consider it like a “floor” that prices tend to rebound from.
- Resistance: A price point where increased selling stops prices from rising further. It acts as a “ceiling” where prices stall.
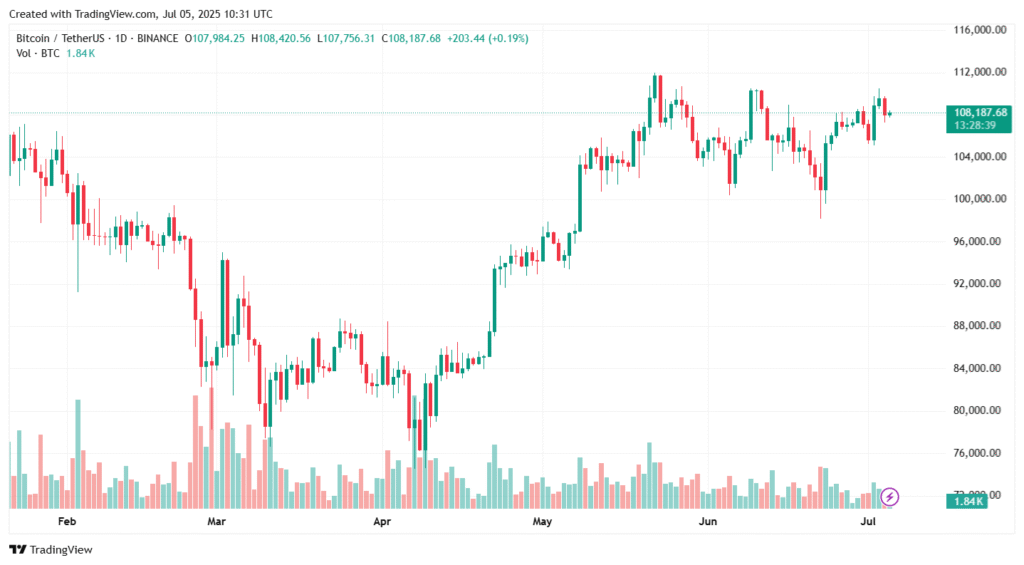
In 2025, psychological levels like $100,000 for Bitcoin or $5,000 for Ethereum often act as strong support or resistance due to trader behavior.
Pro Tip: Use TradingView’s horizontal line tool to mark support and resistance levels. Revisit these levels regularly, as they may shift with market dynamics.
Also Read: The Ultimate Guide: A Step-by-Step Tutorial on How to Buy Bitcoin
Essential Technical Indicators for Beginners
Indicators are mathematical tools that analyze price and volume data to generate trading signals. Here are four beginner-friendly indicators for 2025:
1. Moving Averages (MA)
- Simple Moving Average (SMA): Calculates the average closing price over a set period (e.g., 50-day or 200-day SMA).
- Exponential Moving Average (EMA): Weighs recent prices more heavily, making it more responsive to new data.
- Use Case: A “golden cross” (50-day EMA crossing above 200-day EMA) signals a bullish trend, while a “death cross” (50-day EMA crossing below 200-day EMA) indicates a bearish trend.
2. Relative Strength Index (RSI)
- RSI measures price momentum on a scale of 0 to 100.
- Overbought (Above 70): Suggests a potential pullback due to excessive buying.
- Oversold (Below 30): Indicates a possible bounce due to excessive selling.
- Use Case: Look for divergence (e.g., price making higher highs while RSI makes lower highs) to spot reversals.
3. MACD (Moving Average Convergence Divergence)
- MACD compares two EMAs (e.g., 12-day and 26-day) and includes a signal line and histogram.
- Bullish Signal: MACD line crosses above the signal line.
- Bearish Signal: MACD line crosses below the signal line.
- Use Case: Use the histogram to gauge momentum strength.
4. Bollinger Bands
- Bollinger Bands consist of a 20-day SMA (middle band) with upper and lower bands set two standard deviations away.
- Use Case: Prices touching the upper band may indicate overbought conditions, while touching the lower band suggests oversold conditions. A “squeeze” (bands narrowing) signals potential volatility.
Advanced Strategies for Crypto Chart Analysis
Once you’re comfortable with the basics, try these strategies to enhance your analysis:
1. Combining Indicators
Use multiple indicators to confirm signals. For example, a bullish candlestick pattern (e.g., Hammer) near a support level, combined with an RSI below 30, strengthens a buy signal.
2. Volume Analysis
High volume during a breakout (price moving above resistance or below support) confirms its validity. Low-volume breakouts are often false and should be approached cautiously.
3. Fibonacci Retracement
Fibonacci levels (e.g., 38.2%, 50%, 61.8%) help identify potential reversal zones during pullbacks in a trend. Utilize TradingView’s Fibonacci tool to plot these levels by connecting a swing low to a swing high, or the other way around.
4. Multi-Time Frame Analysis
Examine charts on different time frames to validate trends. For instance, a bullish indication on the 4-hour chart carries more weight if the daily chart is also trending upward.
Practice Tip: Use TradingView’s replay feature to backtest these strategies on historical crypto data to build confidence.
Common Mistakes to Avoid in 2025
- Overloading Charts: Using too many indicators can lead to confusion. Stick to 2-3 reliable ones.
- Ignoring Volume: Weak volume can invalidate patterns or breakouts.
- Chasing Trades: Entering a trend too late often leads to buying at peaks or selling at bottoms.
- Neglecting Risk Management: Always set stop-loss orders and risk no more than 1-2% of your capital per trade.
- Overtrading: Avoid forcing trades based on incomplete signals. Patience is key.
Practical Tips for Success in Crypto Trading
- Use TradingView: Leverage TradingView’s tools, such as drawing trendlines, setting alerts, and testing strategies.
- Stay Informed: Monitor crypto market news to understand external factors like regulations or adoption trends affecting prices in 2025.
- Journal Your Trades: Record your trades, including entry/exit points and reasoning, to refine your strategy.
- Start Small: Practice with a demo account or small positions to minimize risk while learning.
- Join Communities: Engage with other traders to share insights and stay motivated.
Conclusion
Mastering technical analysis in 2025 is a powerful way for beginners to navigate the crypto market. By understanding candlestick charts, trends, support/resistance levels, and indicators like Moving Averages, RSI, MACD, and Bollinger Bands, you can make informed trading decisions. Practice on platforms like TradingView, combine indicators for stronger signals, and prioritize risk management to stay ahead in the volatile crypto space. With dedication and discipline, you’ll turn crypto charts into a roadmap for trading success.
FAQs
What is the best chart type for crypto technical analysis?
Candlestick charts are the best for crypto trading due to their detailed visualization of price action, including open, close, high, and low prices.
How do I choose the right time frame for trading?
Day traders should use 1-minute to 1-hour charts, swing traders should use 4-hour to daily charts, and long-term investors should focus on daily or weekly charts.
Can technical analysis work for all cryptocurrencies?
Yes, technical analysis applies to any crypto with sufficient trading volume and price history, though highly volatile or low-liquidity coins may produce less reliable signals.
How do I avoid false signals in technical analysis?
Combine multiple indicators, confirm with volume, and use multi-time frame analysis to reduce false signals. Always practice risk management with stop-loss orders.
- Advertisement -